Halloween is the second biggest retail event of the year, especially as the holiday returns to pre-pandemic levels. From dressing up in costumes to going to Halloween parties, there are plenty of ways to celebrate. And if you’re looking for some interesting statistics about Halloween, we’ve got you covered.
Here are 61 latest Halloween statistics in the U.S. that you need to know.
Halloween Spending Statistics
Discount stores are the most used type of retail store for Halloween purchases in the U.S. (Statista.com)
Halloween enthusiasts will once again start their shopping early, with nearly half (47%) beginning in September or earlier. Forty percent plan to purchase their items at discount stores, 36% will go to specialty Halloween or costume stores and 31% will shop online. (NRF)
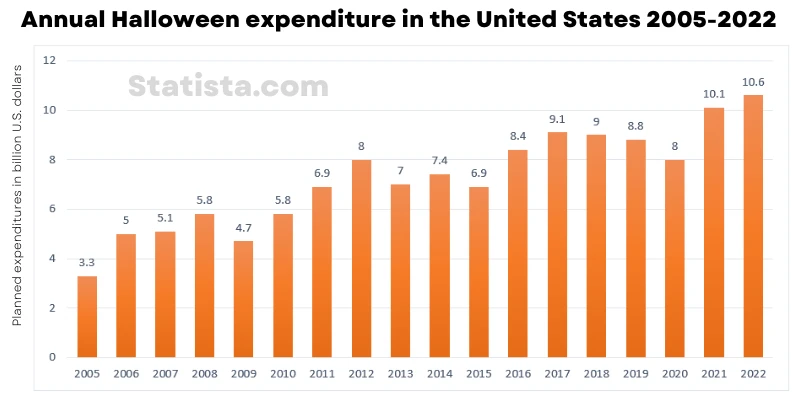
$10.6 billion. Estimated annual Halloween expenditure in the U.S. in 2022 (Statista.com)
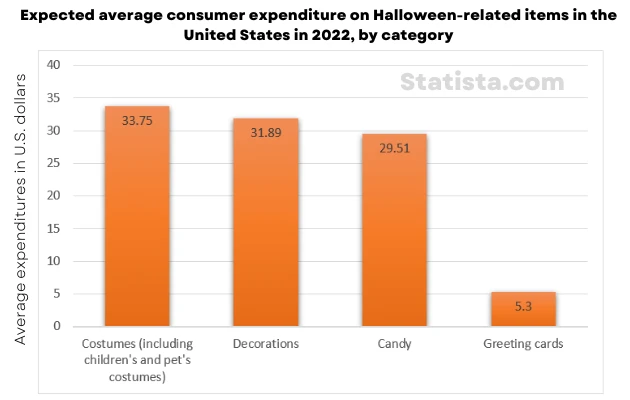
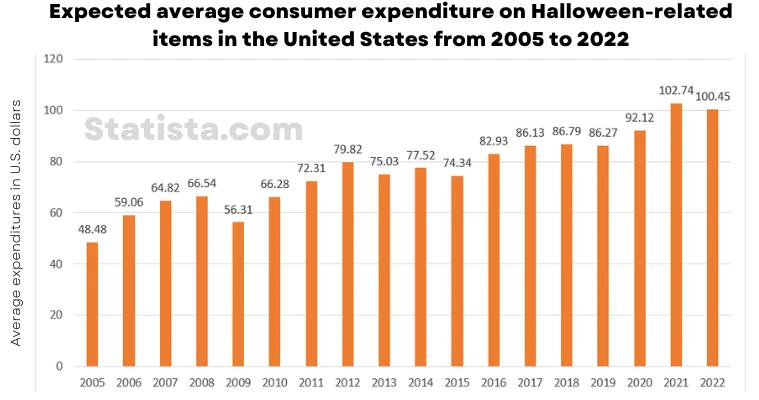
$100.45. Expected average consumer expenditure on Halloween-related items in the U.S. (Statista.com)
$10.6 billion. Total Halloween spending expected in 2022, a new a record, exceeding last year’s record of $10.1 billion. (NRF)
$30. The amount Americans planned to spend on both decorations and costumes for Halloween in 2021. (Statista.com)
21%. Share of U.S. consumers who expect to spend more this Halloween. (Statista.com)
20%. Percentage of celebrants in the United States that expected to spend more in 2021 than they typically had in previous years. About two-thirds of Halloween shoppers intended to spend about the same as usual. (Statista.com)
43%. Percentage of consumers who were planning to buy Halloween decorations in-store in 2020. (Statista.com)
$100. Amount that consumers plan to spend on average for Halloween candy, décor, cards, and costumes. This amount is on par with last year’s record of $103. (NRF)
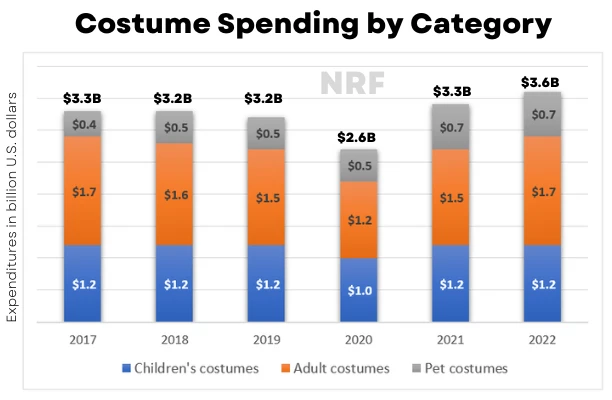
$2.9 billion. Expected spending on kids’ and adult costumes in 2022, the highest amount since 2017. (NRF)
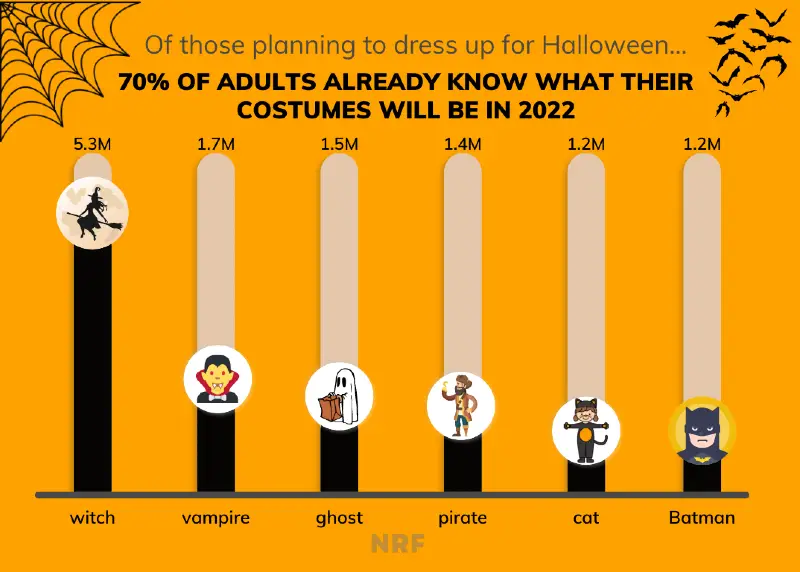
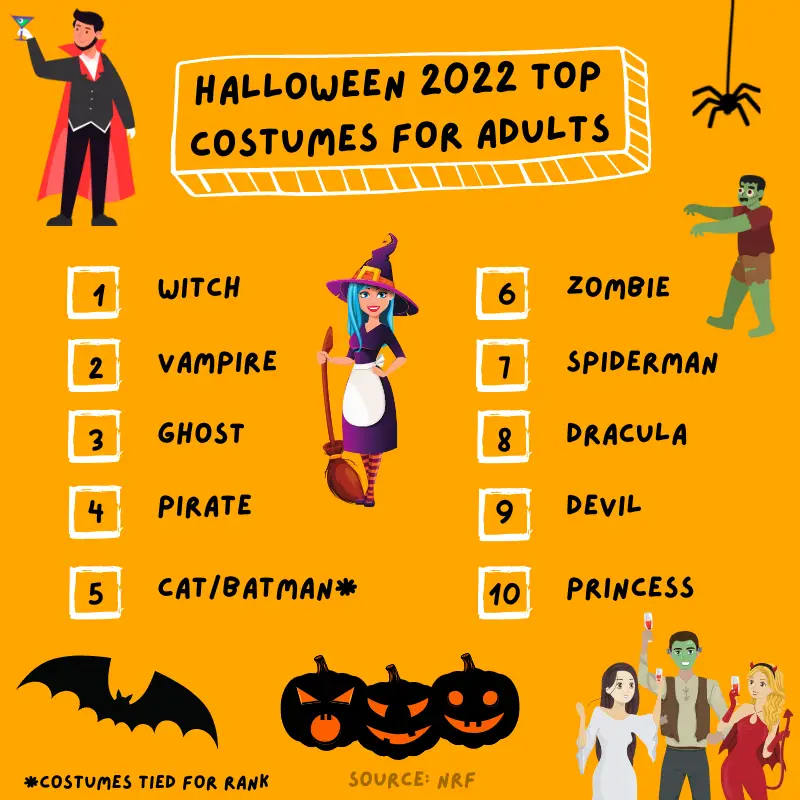
Halloween Costume Statistics – Adults
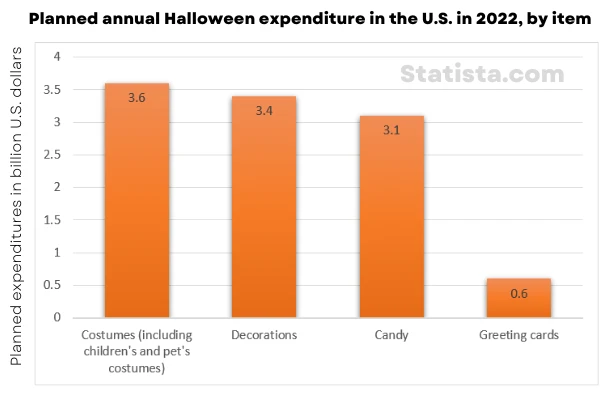
$3.66 billion. Amount consumers in the United States are expected to spend on costumes in 2022, or just under $35 per person. (Statista.com)
780. The number of formal wear and costume rental establishments in the United States in 2020. (census.gov)
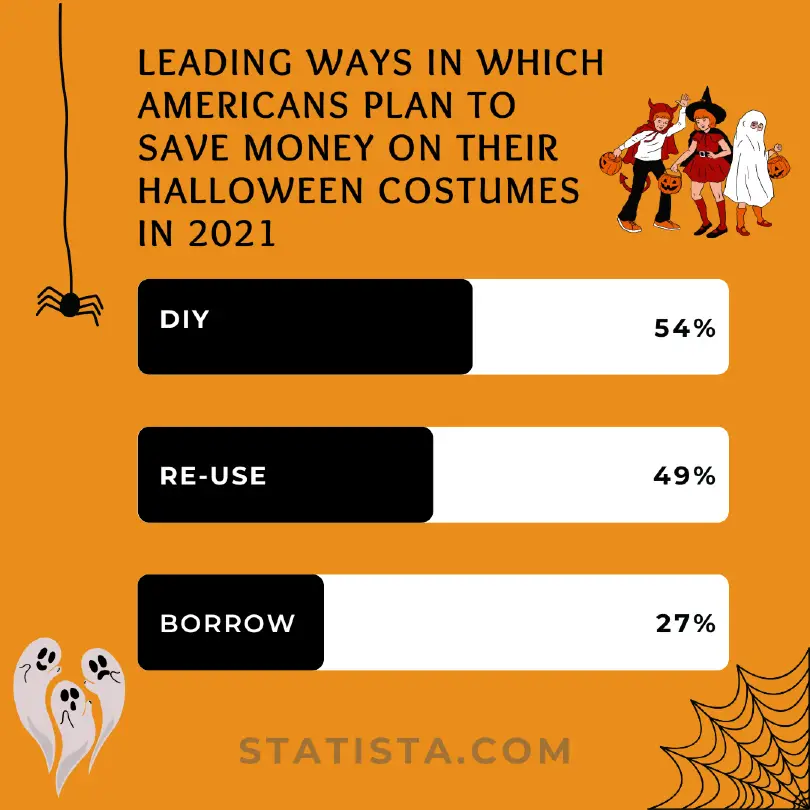
27%. Share of U.S. consumers that plan to borrow a Halloween costume to save money. (Statista.com)
11.49%. Share of U.S. consumers who pick Halloween costumes based on trends or memes. (Statista.com)
In 2021, over a quarter of adults in the United States said they were planning to wear costumes based off characters from TV shows or movies. Nearly four in ten Americans said they would keep things simple by acquiring a spooky sweater or by creating an outfit themselves. (Statista.com)
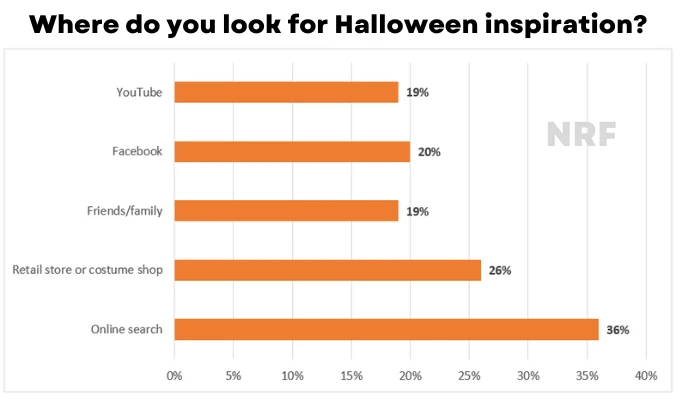
Pinterest. Where nearly a quarter of female consumers said that they got their Halloween ideas from in 2021. Male consumers, on the other hand, were more likely to use YouTube for inspiration. (Statista.com)
Approximately one in ten adults in the United States was planning to coordinate their costume with another person in 2021. About 60 percent of Americans did not intend to wear corresponding or matching outfits. (Statista.com)
8.9%. Percentage of respondents that stated that they would dress up as a witch for Halloween in 2019. (Statista.com)
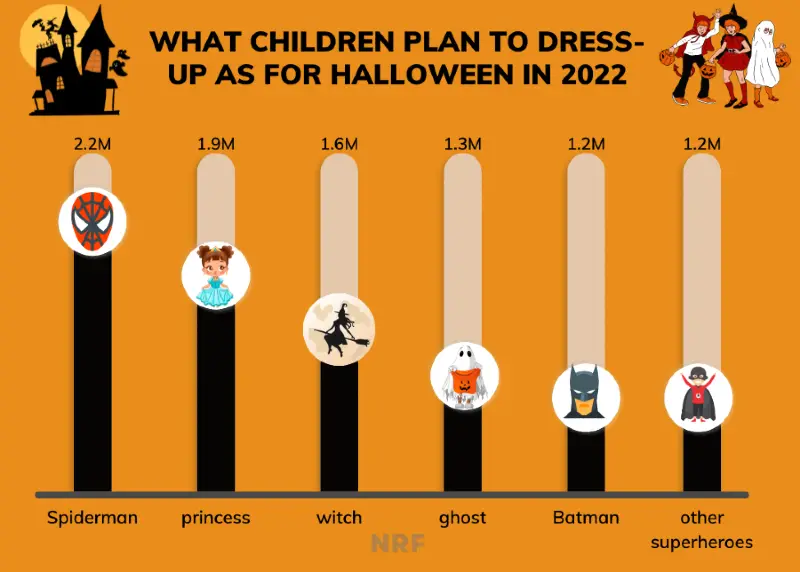
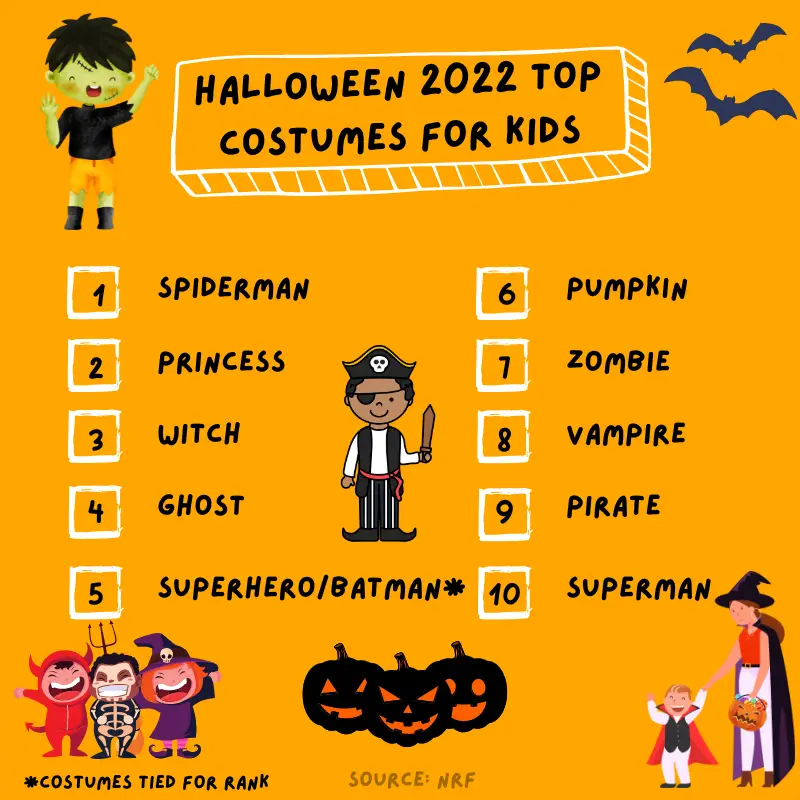
Halloween Costume Statistics – Kids
7.9%. Percentage of respondents that stated that their child would dress up as a princess for Halloween in 2019. (Statista.com)
73.1 million. The estimated number of children under age 18 in 2019. (census.gov)
57.4 million. The number of housing units with steps that trick-or-treaters has to climb to collect their treats in 2020. (census.gov)
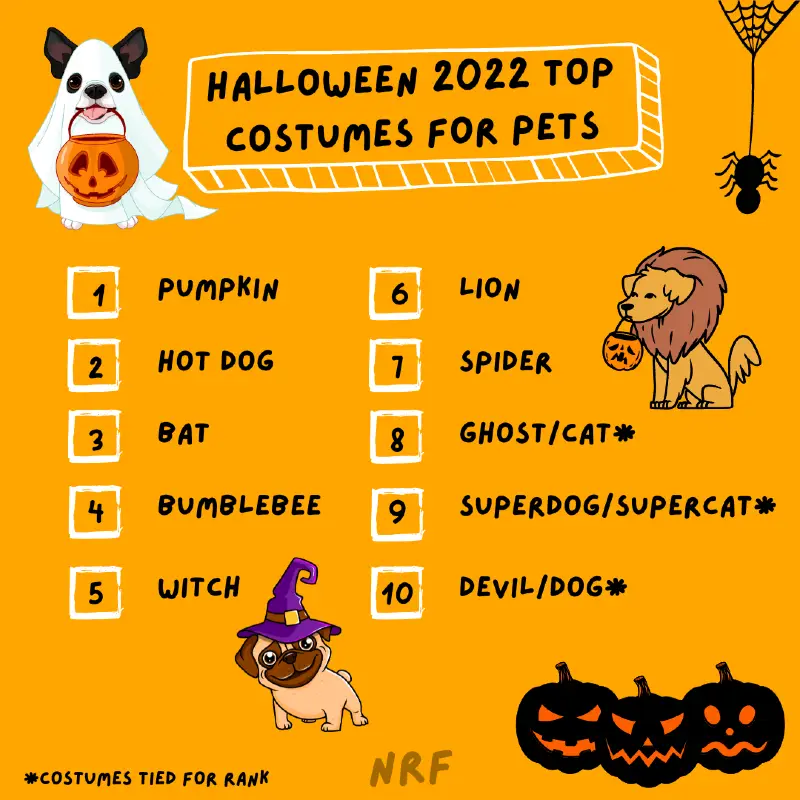
Statistics on Pets in Halloween Costumes
20%. Percentage of consumers who plan to dress their pet up in a costume in 2022. (NRF)
$710 million. Amount pet owners are expected to spend in 2022, a new record high. (NRF)
10%. Percentage of respondents that stated that they would dress up their pet as a pumpkin for Halloween in 2021. (Statista.com)
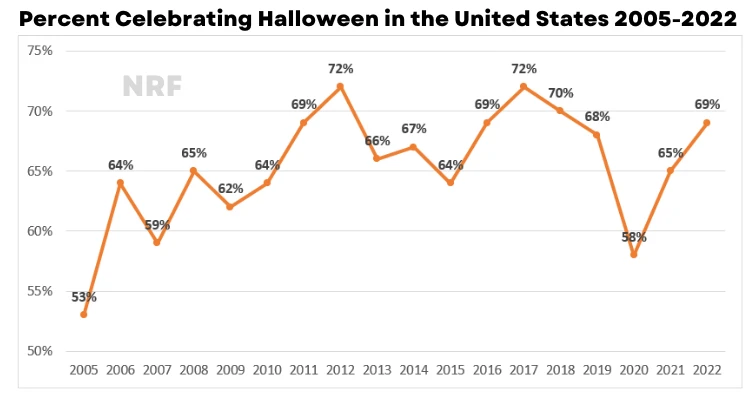
Celebrating Halloween Statistics
69%. Percentage of consumers planning to celebrate Halloween in 2022, up from 65% in 2021 and comparable to 68% in 2019. (NRF)
$3.4 billion. Annual Halloween decoration expenditure in the U.S. (Statista.com)
$100. Amount consumers in the United States are planning to spend on Halloween items in 2022. Expected per capita expenditure on Halloween-related products dropped by roughly two U.S. dollars compared to 2021. (Statista.com)
18.5%. Share of Americans planning to visit a haunted house. (Statista.com)
Pumpkins Make Everything Nice
$707.98 million. Total expenditure on pumpkins during Halloween in the U.S. (Statista.com)
$4.83. Average price of pumpkins during Halloween in the U.S. (Statista.com)
16.49m cwt. Annual U.S. pumpkin production. (Statista.com)
At 15,900 acres, Illinois harvested over double the pumpkin acreage of any other state in 2020. Runner-up pumpkin producers include California, Indiana, Michigan, Texas and Virginia, which all harvested between 3,700 and 6,000 acres in 2020. (usnews.com)
564 million pounds. The amount of pumpkins Illinois produced in 2020 – about as much as the other top five pumpkin-producing states combined. (usnews.com)
80%. Percentage of Illinois’ pumpkin production that become pie filling or puree. (usnews.com)
COVID-19’s Chilling Effects on Halloween
31%. The percentage of parents who were not going to allow their children to trick-or-treat on Halloween in 2020. (Statista.com)
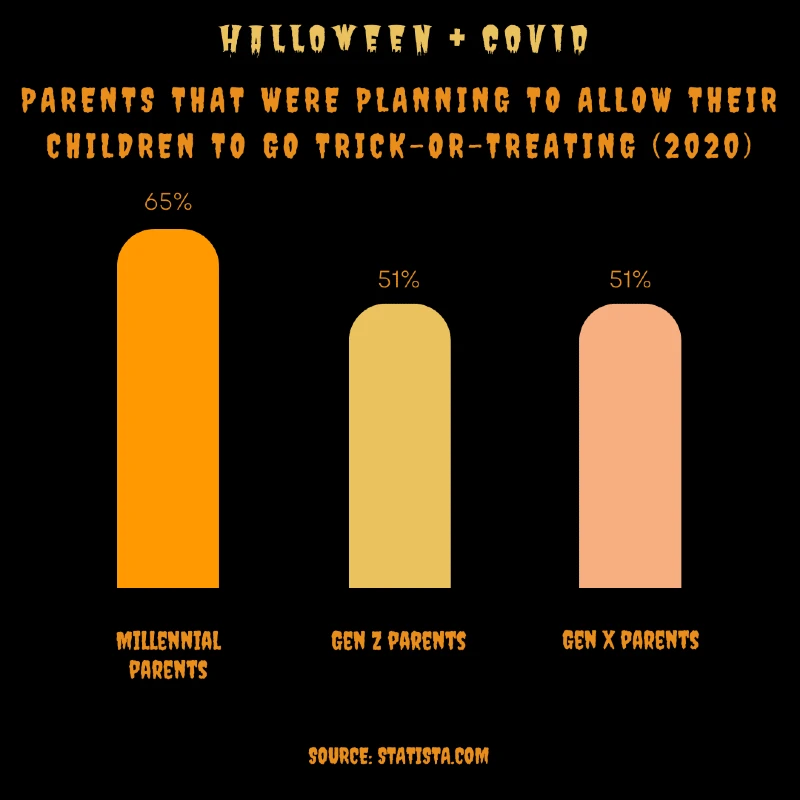
Over 70%. The percentage of parents who intended to allow their children to trick-or-treat in 2021 but only while wearing a mask and practicing social distancing. (Statista.com)
Approximately 70%. The percentage of consumers in the United States that believed the coronavirus pandemic would affect how they celebrate Halloween in 2021. (Statista.com)
16%. The percentage of consumers who believed the pandemic would have a major impact on their Halloween celebrations in 2021. Nearly one third of Americans said their celebration plans would not be affected in any way. (Statista.com)
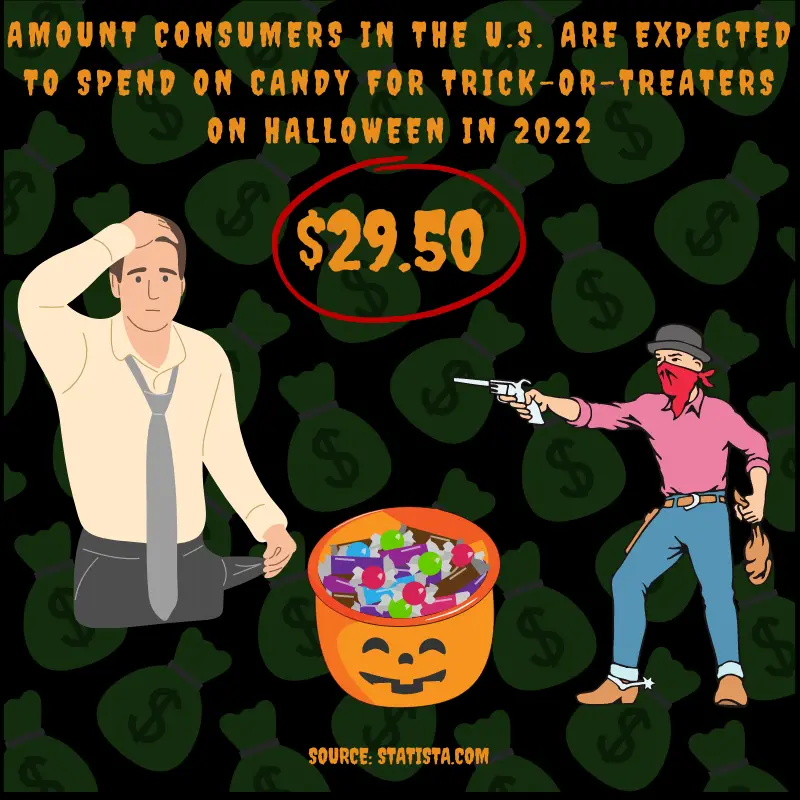
Halloween Candy Statistics
$3 billion. Amount consumers in the United States are expected to spend on trick-or-treat candy for the Halloween season. (Statista.com)
49%. Percentage of people who were planning to shop in-store for Halloween candy in 2020. (Statista.com)
47%. Percentage of consumers that planned to spend up to $20 on Halloween candy. 40% planned to spend between 21 and 40 U.S. dollars. (Statista.com)
90%. The percentage of U.S. consumers who indicated that they would buy anything with chocolate. The second most popular candy was chewy/fruity, while around 20 percent of respondents planned to purchase nut-filled sweets. (Statista.com)
264. The number of U.S. establishments that primarily produced chocolate products from cocoa beans in 2020. (census.gov)
3,320. The number of U.S. confectionery and nut stores in 2020. (census.gov)
Blog Post Sharing Policy
You have our permission to share any of these statistics or charts as long as you include a dofollow link back to this page.
You may also be interested in… 145 Latest U.S. Gardening Statistics and Trends

Darrell has a passion for gardening that he inherited from his father. Go here to read more about the influence his father played in his love for gardening. If you want to send Darrell a quick message, then visit his contact page here.